Analyzing Token Trends, Regardless of the Harness
Last post in this series I argued you have to measure agent spend before you can manage it — that the bill is real money and most teams are flying blind on where it goes. Fair enough. But I want to correct an impression that post probably left, because I left it on myself first.
Measuring spend is not the same as understanding it. A number is not an insight. I spent a couple of weeks proud of a dashboard that told me, precisely, that we’d burned a certain dollar amount on tokens that month. And then I sat there and realized I had no idea whether that number was good, bad, normal, or a five-alarm fire. I had a fact. I had no decision.
That’s the trap. The raw spend figure is noise until you can see the trend. $400 this month means nothing. $400 this month after $180 last month means something — and it means something different depending on whether your usage doubled, your prompts got fatter, or someone shipped an agent that re-reads the entire repo on every turn. The number you can act on is never the level. It’s the slope, and what’s underneath it.
So this post is about the part I skipped: how you actually analyze the spend once you’re collecting it. And the first problem you hit is that the spend isn’t coming from one place.
The harness is the wrong unit of analysis
Here’s the situation most teams are actually in, whether they’ve admitted it or not. Some people drive Claude Code. Some live in Cursor. There’s a cron agent quietly summarizing pull requests at 6am. There’s a one-off script someone wrote that calls the API directly. Each of these is a harness — a different wrapper around the same underlying model spend — and each one reports its costs differently, if it reports them at all.
The instinct is to analyze each harness on its own terms. Resist it. The harness is an implementation detail. You do not care that “Cursor cost $X and Claude Code cost $Y” any more than your CFO cares which brand of laptop a line item came from. You care what the money bought. And what it bought — a feature, a refactor, a flaky-test investigation — almost never respects harness boundaries. The same engineer shipping the same feature might touch three of them in a day.
So the foundational move is to stop treating “which tool” as the primary axis and start treating it as just another tag. Which means everything has to land in one place, in one shape, first.
Normalize before you analyze

You cannot trend data you can’t compare, and you can’t compare data that isn’t shaped the same. This is the unglamorous 80% of the work, and skipping it is why most cost dashboards are quietly lying.
Every harness emits something — usage events, a log line, an API response with a usage block. Your job is to funnel all of it through one normalizer that flattens each event into the same record. At minimum I want, per event:
- Tokens in / tokens out / cached tokens, separated. Lumping them hides the single biggest lever you have. (If “cached tokens” means nothing to you yet, that’s the subject of a later post — but you have to capture the field now or you can never measure the win.)
- Model. A trend that mixes a cheap model and an expensive one is uninterpretable.
- Cost, computed by you from tokens and a model price table — not trusted from whatever the tool reported. Tools round, omit caching, and price inconsistently.
- Timestamp, because this whole post is about time.
- Attribution tags: who, what feature, what agent/harness, what repo.
That last bullet is the one everything hinges on, so it gets its own section. But notice the shape of the goal: one flat event stream, harness-agnostic, where the harness is reduced to a column you can filter on or ignore. Once your cron agent’s spend and your IDE’s spend are the same kind of row, you can finally add them up and watch them move together. Until then you have three dashboards and no answers.
A word of caution that I learned the slow way: don’t trust the tool’s own cost number as gospel — recompute it. I’ve written before about how you should trust but verify the things agents hand you, and a vendor’s usage report is no different. Capture the raw token counts and derive cost yourself, so when a price changes or a tool under-reports caching, your history stays consistent and you’re not re-litigating six months of bad data.
Attribution is the whole game
Total spend is a vanity metric. The question that actually changes behavior is “spend on what?” — and “what” has a few useful shapes:
- Per feature. This is the holy grail and the hardest. If you can tie a cluster of token spend to a ticket or a branch, you can finally ask the only question that matters: did this feature cost $30 or $300 to build with agents, and was it worth it? That’s a real engineering economics conversation. Without attribution it’s a vibe.
- Per agent. Your planner agent, your test-writer, your reviewer — they have wildly different cost profiles. Trending spend per agent is how you find the one quietly burning 10x its peers because it re-loads context it doesn’t need.
- Per person. Not to rank people — please don’t rank people — but because a sudden spike from one engineer is usually a signal: a misconfigured loop, a runaway agent, or a genuinely hard problem worth helping with.
The mechanism is boring and that’s fine: stamp every event with tags at the source. Branch name, ticket ID, agent name, harness, user. The transcripts already carry most of this if you bother to look — the cwd and the git branch are sitting right there in every event. You don’t need a fancy system. You need the discipline to attach the tags before the data lands, because you can never reconstruct attribution after the fact.
Now you can actually spot a regression
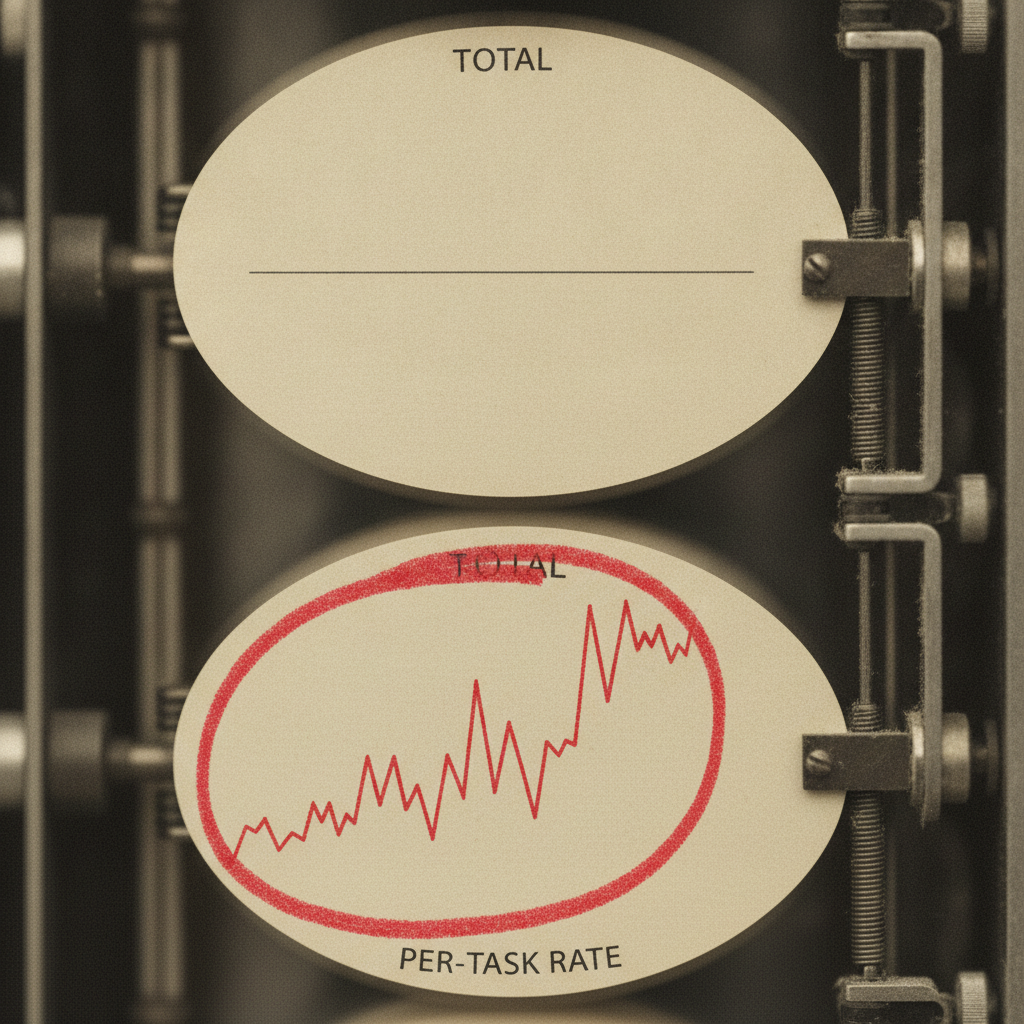
This is the payoff, and it’s the same shape as catching a performance regression in CI. Once you have a normalized, attributed, time-series stream, you stop asking “what did we spend” and start asking “what changed.”
The cost regressions worth catching almost never announce themselves in the total. They hide:
- An agent whose average tokens-per-task crept up 40% over three weeks because its context-loading got greedy. Total spend looked flat because volume dipped. The per-task trend caught it.
- A prompt change that quietly doubled input tokens on a hot path. Invisible in the monthly number, obvious in the per-agent daily slope.
- A cache hit rate that quietly fell off a cliff after a refactor moved the stable content around, so you started paying full freight for context you used to get nearly free.
None of those are visible in “we spent $X this month.” All of them are obvious the moment you’re watching the right rate over time. The level tells you the weather today. The trend tells you the climate — and regressions live in the climate.
There’s a deeper reason trends matter more than snapshots, and it’s the same reason I keep harping on doing things the same way twice: a trend is only meaningful if the thing underneath it is stable enough to compare. If your measurement method drifts — you change how you compute cost, or how you tag, or which events you capture — your trend line is measuring your own inconsistency, not your spend. Lock the method, then watch the slope.
Decisions, not dashboards
I’ll close on the thing I most want to land, because it’s the mistake I made.
It is genuinely fun to build the dashboard. Pretty charts, real-time spend tickers, a leaderboard of your hungriest agents. And it is almost entirely useless if it doesn’t change a decision. A dashboard nobody acts on is just an expensive way to feel informed.
So hold every piece of this analysis to one bar: what decision does it let me make? Per-feature spend lets me decide whether agentic delivery is paying off on this kind of work. Per-agent trends let me decide which agent to go optimize next. A regression alert lets me decide to roll back a prompt change before it bills me for a month. Tie spend to value delivered, or don’t bother measuring it.
The bill is the noise. The trend, normalized across every harness and attributed to the work, is the signal. And the signal is only worth extracting if you’re going to do something with it.
Next in the series: the single biggest lever hiding in those token counts — caching — and why most of the savings is sitting on the floor.
Comments